
Introduction to Economics 1 Deneme Sınavı Sorusu #561085
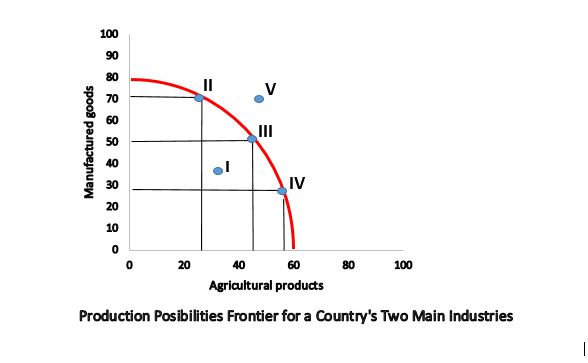 The above figure shows the ‘production possibilities frontier’ for a country’s two main industries, which are hypothetically sampled here as manufactured goods and agricultural products. Which blue point shows the least desirable level for this country’s production?
|
I |
|
II |
|
III |
|
IV |
|
V |
Production possibilities frontier is a graph that shows the combinations of output that a firm or a society can possibly produce using the available production technology and the given amount of inputs. Therefore, the Production possibilities frontier is a very useful analytical tool to illustrate the basic economic concepts such as scarcity, efficiency, tradeoffs and opportunity cost. Of course, whole economies in real life produce thousands of goods and services. However, our graph in the question is a simplified form as if there were only industries where all resources available to the economy are used. The points II, III, and IV show that the more manufactured goods are produced, the less agricultural products are produced, and vice versa. This shows that this country uses its all resources fully and efficiently. The point V, on the other hand, might show desirable production level, but it would be impossible to reach there with the given available resources and technology. The point I indicates a production level that this country would definitely avoid because this point shows that it is either using its scarce resources fully but inefficiently, or it is leaving some of the resources idle. The correct answer is A.
Yorumlar
- 0 Yorum