
Statıstıcs I Final 10. Deneme Sınavı
Toplam 20 Soru1.Soru
Probability density function for continuous random variable X is defined as follows;
f(x) = 0.02, for 0 ? x ? 50
Which of the following mean of the continuous random variable X?
Probability density function for continuous random variable X is defined as follows;
f(x) = 0.02, for 0 ? x ? 50
Which of the following mean of the continuous random variable X?
|
25 |
|
50 |
|
60 |
|
80 |
|
150 |
µ=E(X)= ?xf(x)dx= ?(0.02x)dx=25
2.Soru
- Arithmetic mean
- Standard deviation
- Variance
Which of the above determine(s) the shape of the normal random variable?
|
Only III |
|
I and II |
|
I and III |
|
II and III |
|
I, II and III |
The shape of the normal random variable is determined by the mean μ and the standard deviation σ of the distribution.
3.Soru
A bakery employs 10 people. The number of years’ experience that the employees of the company have is the following: 0, 0, 2, 4, 5, 8, 15, 17, 20, 24. What is the interquartile range of the data?
|
10 |
|
15 |
|
20 |
|
25 |
|
30 |
4.Soru
In binomial distribution, "The probability of success, denoted by and the probability of failure, denoted by remains _____________ for all trials"?
|
different |
|
changes trial to trial |
|
constant |
|
variable |
|
fluctuates |
The probability of success, denoted by and the probability of failure, denoted by remains constant for all trials
5.Soru
What is 'the most frequent value in the entire data' called?
|
Trimmed mean |
|
Median |
|
Geometric mean |
|
Mode |
|
Arithmetic mean |
Mode is the most frequent value in the entire data. The correct answer is D.
6.Soru
In a study about employess, employees are classified according to the department they work in and their preference of training coursec. If there are 12 different departments and 7 different courses, in how many different ways can an employee be classified?
|
72 |
|
19 |
|
84 |
|
12 |
|
7 |
In a study about college students, students are classified according to their department and preference of language course. If there are 10 different departments and 5 different language courses, in how many different ways can a student be classified? According to the basic principle of counting, it follows that there are in total 10.5=50 different possible classifications.
In a study about employess, employees are classified according to the department they work in and their preference of training courses. If there are 12 different departments and 7 different courses, according to the basic principle of counting, itf ollows that there are in total 12.7=84 different possible classifications.
7.Soru
Which option is NOT correct about the probability density function?
|
Probabilities in continuous random variables can be determined from the area under probability density function. |
|
The probability density function f (x), defines the physical characteristics of the random variable. |
|
Probability density function basically determines the shape of the distribution for the continuous random variable X. |
|
The area under the probability density function f (x) is always greater than 1. |
|
For a continuous random variable X, probability density function f (x)³0 for all x. |
The area under the probability density function f (x) is always equivalent to 1
8.Soru
What is the variance of f(x) = x for 0 ? x ? 4 equal to?
|
4 |
|
8 |
|
16 |
|
32 |
|
64 |
The variance is equal to V (X) = E (X2) - [E (X)]2 for f(x) = x for 0 ? x ? 4 the f(x2)=x2 which would indicate that x*x2 is the function to take the integral in order to find the variance. The integral of x3 is x4/4 on 0 ? x ? 4 would yield to the difference of the value found from x = 4 and x = 0. For x=4 the value is 64 and for x=0 the value is 0. The difference between these values is 64. The answer is E.
9.Soru
Which one below gives us the difference between Dot slot and Stem-and-Leaf Display?
|
A stem-and-leaf display is a type of graph for listing the numerical data. |
|
In stem-and-leaf display the original numbers are kept. |
|
Stem-and-leaf display are drawn for continuous data. |
|
Stem-and-leaf display is usually used for categorical |
|
Stem-and-leaf is often used to display the trends in a continuous data over a period of time |
A stem-and-leaf display is a type of graph for listing the numerical data and very similar to dot plot. If you remember in dot plot, dots are used to represent the each observation in our data. In stem-and-leaf display the original numbers are kept and a visual representation of data is created.
A pie chart is usually used for categorical data. Line chart is often used to display the trends in a continuous data over a period of time.
10.Soru
Consider the probability distribution for the random variable X given below and determine the probability of P (1.5 < X ? 4) =?
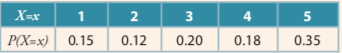
Consider the probability distribution for the random variable X given below and determine the probability of P (1.5 < X ? 4) =?
|
0,4 |
|
0,5 |
|
0,35 |
|
0,45 |
|
0,70 |
0,5
11.Soru
Which of the following is a discrete random variable?
|
The sitting time interval of students in a library. |
|
The weight of the books in a library. |
|
The heat of a library. |
|
The height of the students in a library. |
|
The blood pressures of the students in a library. |
Discrete random variables have only a countable number of separate values such as 0, 1, 2 , 3... etc. In addition to above examples, the number of students in a class for certain day or the number of customers in a supermarket after 5:00 PM are cases for discrete random variables since these variables are finite and countable. Conversely, continuous random variable can take entire infinite values in a given interval. Because of this reason, continuous random variables are commonly measured instead of counted.
12.Soru
Data : 12, 16, 10, 20, 12 ; what is the mean deviation of these data ?
|
3.2 |
|
4.6 |
|
5.2 |
|
4.4 |
|
3.8 |
arithmetic mean : m = 70 / 5 = 14 ; s = (4 + 2 + 2 + 2 + 6) / 5 = 16 / 5 = 3.2 ; . pg. 112. Correct answer is A.
13.Soru
I. The central tendency measure of the distribution
II. A measure of the variability of the observations
III. The information of the distribution shape
Which pieces of information given above can be obtained from a box-plot?
|
Only I |
|
Only II |
|
I and II |
|
II and III |
|
I, II and III |
What information can we obtain from a box plot? The central tendency measure of the distribution is indicated by the median line in the box plot. A measure of the variability of the observations is given by the length of the box. Also, by examining the relative location of the median line, we can obtain about the information of the distribution shape. The correct answer is E.
14.Soru
We have a box containing only red and blue balls. If we randomly pick up a ball from this box, it could only be either a red ball or a blue ball, the selected ball cannot be a ball of red and blue at the same time. The occurrence of one event dictates that none of the other events can occur at the same time.
How is this event called?
|
Multiplication rule |
|
Statistically independent |
|
Empirical probability |
|
Subjective Probability |
|
Mutually exclusive |
In probability, if the occurrence of one event dictates that none of the other events can occur at the same time, we call this event mutually exclusive events.
15.Soru
I. The number of students in a class.
II. The time spent on doing an assignment.
III. The height of the students.
IV. The number of laptops in a school.
Which of the variables above is an example of a discrete random variable?
|
I and II. |
|
I and IV. |
|
All of them |
|
None of them |
|
II and III. |
Discrete random variables have only a countable number of separate values such as 0, 1, 2, 3... etc.
16.Soru
For X which is a continuous random variable that is uniformly distributed and takes values between 3 and 9. What is the probability density function of the random variable X ?
|
f(x)=0 for 3≤x≤9 f(x)=1/6 otherwise |
|
f(x)=1/6 for 3≤x≤9 f(x)=0 otherwise |
|
f(x)=1/3 for 3≤x≤9 f(x)=0 otherwise |
|
f(x)=1/2 for 3≤x≤9 f(x)=0 otherwise |
|
f(x)=1/6 |
For X which is a continuous random variable that is uniformly distributed and takes values between 3 and 9, the minimum value of the random variable X is 3 (it’s the value of a) and the maximum value is 9 (it’s the value of b). Then X~U (a=3, b=9) and the probability density function of the continuous random variable X is defined as, f (x) = 1/(b − a) = 1/(9 − 3)= 1/6 for 3≤x≤9. The answer is B.
17.Soru
For two sets A and B the probability of A is 0.15 and the probability of B is 0.25 if P(A|B) is equal to 0.30 what is the value of P(B|A)?
|
0.05 |
|
0.10 |
|
0.125 |
|
0.18 |
|
0.5 |
According to the Bayes's Theorem P(B|A) is equal to [P(A|B)*P(B)]/P(A). The values are given as so P(A|B)=0.30, P(B)=0.25 and P(A)=0.15. P(B|A)=(0.30*0.25)/(0.15) = 0.5. The answer is E.
18.Soru
What is mode?
|
Middle number when the data is ordered from smallest to largest |
|
Interval scale |
|
Middle number when the data is ordered from largest to smallest |
|
Ratio Scale |
|
Most frequent value(s) |
19.Soru
A shop selling mobile phones has purchased four new mobile phones of the same brand and model. It is known that a mobile phone of this brand and model works without any problem for at least 2 years with probability 0.95. What is the probability that all three mobile phones will work without any problem for at least 2 years?
|
0.95 |
|
0.90 |
|
0.85 |
|
0.80 |
|
0.75 |
Here, it is natural to assume that a failure of a mobile phone is independent from a failure of another mobile phone. Therefore, if Ai(i=1,2,3,4) denotes the event that the i-th mobile phone will work without any problem for at least 2 years, then the probability is given by
P(A1+A2+A3+A4) = P(A1)P(A2)P(A3)P(A4) = (0.90).
The correct answer is B.
20.Soru
According to classical probability, when a fair dice is rolled, what is the probability of obtaining a number more than 4?
|
0.167 |
|
0.267 |
|
0.333 |
|
0.433 |
|
0.555 |
Using the same idea, we can try another example, what is the probability of obtaining a number more than 4 if we throw a six-sided fair die? Remember on a six-sided fair die, all the outcomes have the same chance to appear, in this example the question makes a restriction of observing values more than 4. ere are only two outcomes to satisfy this restriction; those are the numbers 5, and 6; therefore, the probability we are looking for is
P(Morethan 4) = 2/6 = 1/3 = 0.333
The correct answer is C.
-
- 1.SORU ÇÖZÜLMEDİ
- 2.SORU ÇÖZÜLMEDİ
- 3.SORU ÇÖZÜLMEDİ
- 4.SORU ÇÖZÜLMEDİ
- 5.SORU ÇÖZÜLMEDİ
- 6.SORU ÇÖZÜLMEDİ
- 7.SORU ÇÖZÜLMEDİ
- 8.SORU ÇÖZÜLMEDİ
- 9.SORU ÇÖZÜLMEDİ
- 10.SORU ÇÖZÜLMEDİ
- 11.SORU ÇÖZÜLMEDİ
- 12.SORU ÇÖZÜLMEDİ
- 13.SORU ÇÖZÜLMEDİ
- 14.SORU ÇÖZÜLMEDİ
- 15.SORU ÇÖZÜLMEDİ
- 16.SORU ÇÖZÜLMEDİ
- 17.SORU ÇÖZÜLMEDİ
- 18.SORU ÇÖZÜLMEDİ
- 19.SORU ÇÖZÜLMEDİ
- 20.SORU ÇÖZÜLMEDİ